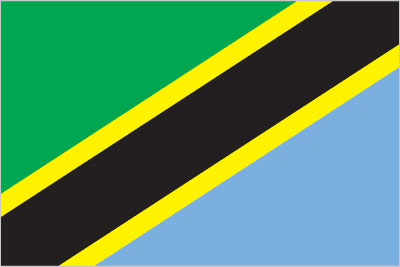
Tanzania is one of the world's poorest economies in terms of per capita income, however, it has achieved high overall growth rates based on gold production and tourism. Tanzania has largely completed its transition to a liberalized market economy, though the government retains a presence in sectors such as telecommunications, banking, energy, and mining. The economy depends on agriculture, which accounts for more than one-quarter of GDP, provides 85% of exports, and employs about 80% of the work force. The World Bank, the IMF, and bilateral donors have provided funds to rehabilitate Tanzania's aging economic infrastructure, including rail and port infrastructure that are important trade links for inland countries. Recent banking reforms have helped increase private-sector growth and investment, and the government has increased spending on agriculture to 7% of its budget. The financial sector in Tanzania has expanded in recent years and foreign-owned banks account for about 48% of the banking industry's total assets. Competition among foreign commercial banks has resulted in significant improvements in the efficiency and quality of financial services, though interest rates are still relatively high, reflecting high fraud risk. All land in Tanzania is owned by the government, which can lease land for up to 99 years. Proposed reforms to allow for land ownership, particularly foreign land ownership, remain unpopular. Continued donor assistance and solid macroeconomic policies supported a positive growth rate, despite the world recession. In 2008, Tanzania received the world's largest Millennium Challenge Compact grant, worth $698 million, and in December 2012 the Millennium Challenge Corporation selected Tanzania for a second Compact. Dar es Salaam used fiscal stimulus and loosened monetary policy to ease the impact of the global recession. GDP growth in 2009-13 was a respectable 6-7% per year due to high gold prices and increased production.
$79.29 billion (2013 est.)
country comparison to the world: 83
$74.12 billion (2012 est.)
$69.31 billion (2011 est.)
7% (2013 est.)
country comparison to the world: 22
6.9% (2012 est.)
6.4% (2011 est.)
$1,700 (2013 est.)
country comparison to the world: 200
$1,600 (2012 est.)
$1,600 (2011 est.)
agriculture: 27.6%
industry: 25%
services: 47.4% (2013 est.)
36% (2002 est.)
7.8% (2013 est.)
country comparison to the world: 195
16% (2012 est.)
25.59 million (2013 est.)
country comparison to the world: 27
agriculture: 80%
industry and services: 20% (2002 est.)
NA%
agricultural processing (sugar, beer, cigarettes, sisal twine); mining (diamonds, gold, and iron), salt, soda ash; cement, oil refining, shoes, apparel, wood products, fertilizer
7.4% (2013 est.)
country comparison to the world: 30